PhD Data Science
With a passion for data analysis, statistics, software development and all things, I have both the skill set and professional background necessary to dive deep into the data science world. As an upbeat, self-motivated team player with excellent communication, I envision an exciting future in the industry. Browse my site to see all that I have to offer.
Email: | aluchi@bgsu.edu |
Status: | US citizen |
LinkedIn:       | https://www.linkedin.com/in/alex-luchinsky/ |
Jan 2022 — May 2025     | Ph.D in Data Science |
Bowling Green State University | |
GPA: 4.0 | |
Sep 2020 — Dec 2021     | MS in Data Science |
Bowling Green State University | |
GPA: 3.85 | |
Sep 1995 — Aug 2007     | MS, Ph.D in Theoretical Physics |
Moscow Institute o Physics and Technology, Russia | |
GPA: 3.9 |
Aug 2023 — May 2025 |
Data Analyst
Student Success Analysis Technologies (Bowling Green State University, Bowling Green, OH)
|
Aug 2022 — May 2023 |
Adjunct Instructor
Bowling Green State University (Bowling Green, OH)
|
Apr 2021 — Dec 2021 |
Software Developer
Senico Corp (Bowling Green, OH)
|
Aug 2019 — May 2020 |
Adjunct Instructor
Bowling Green State University (Bowling Green, OH)
|
Mathematics | Statistics | Teaching |
C++, R, Python          | Software Development          | Problem-solving abilities |
Modeling | Data Analysis | Machine Learning |
Time Series | Topological Data Analysis | Teamwork |
You can also find list of my High Energy Physics publications following the link Google Scholar
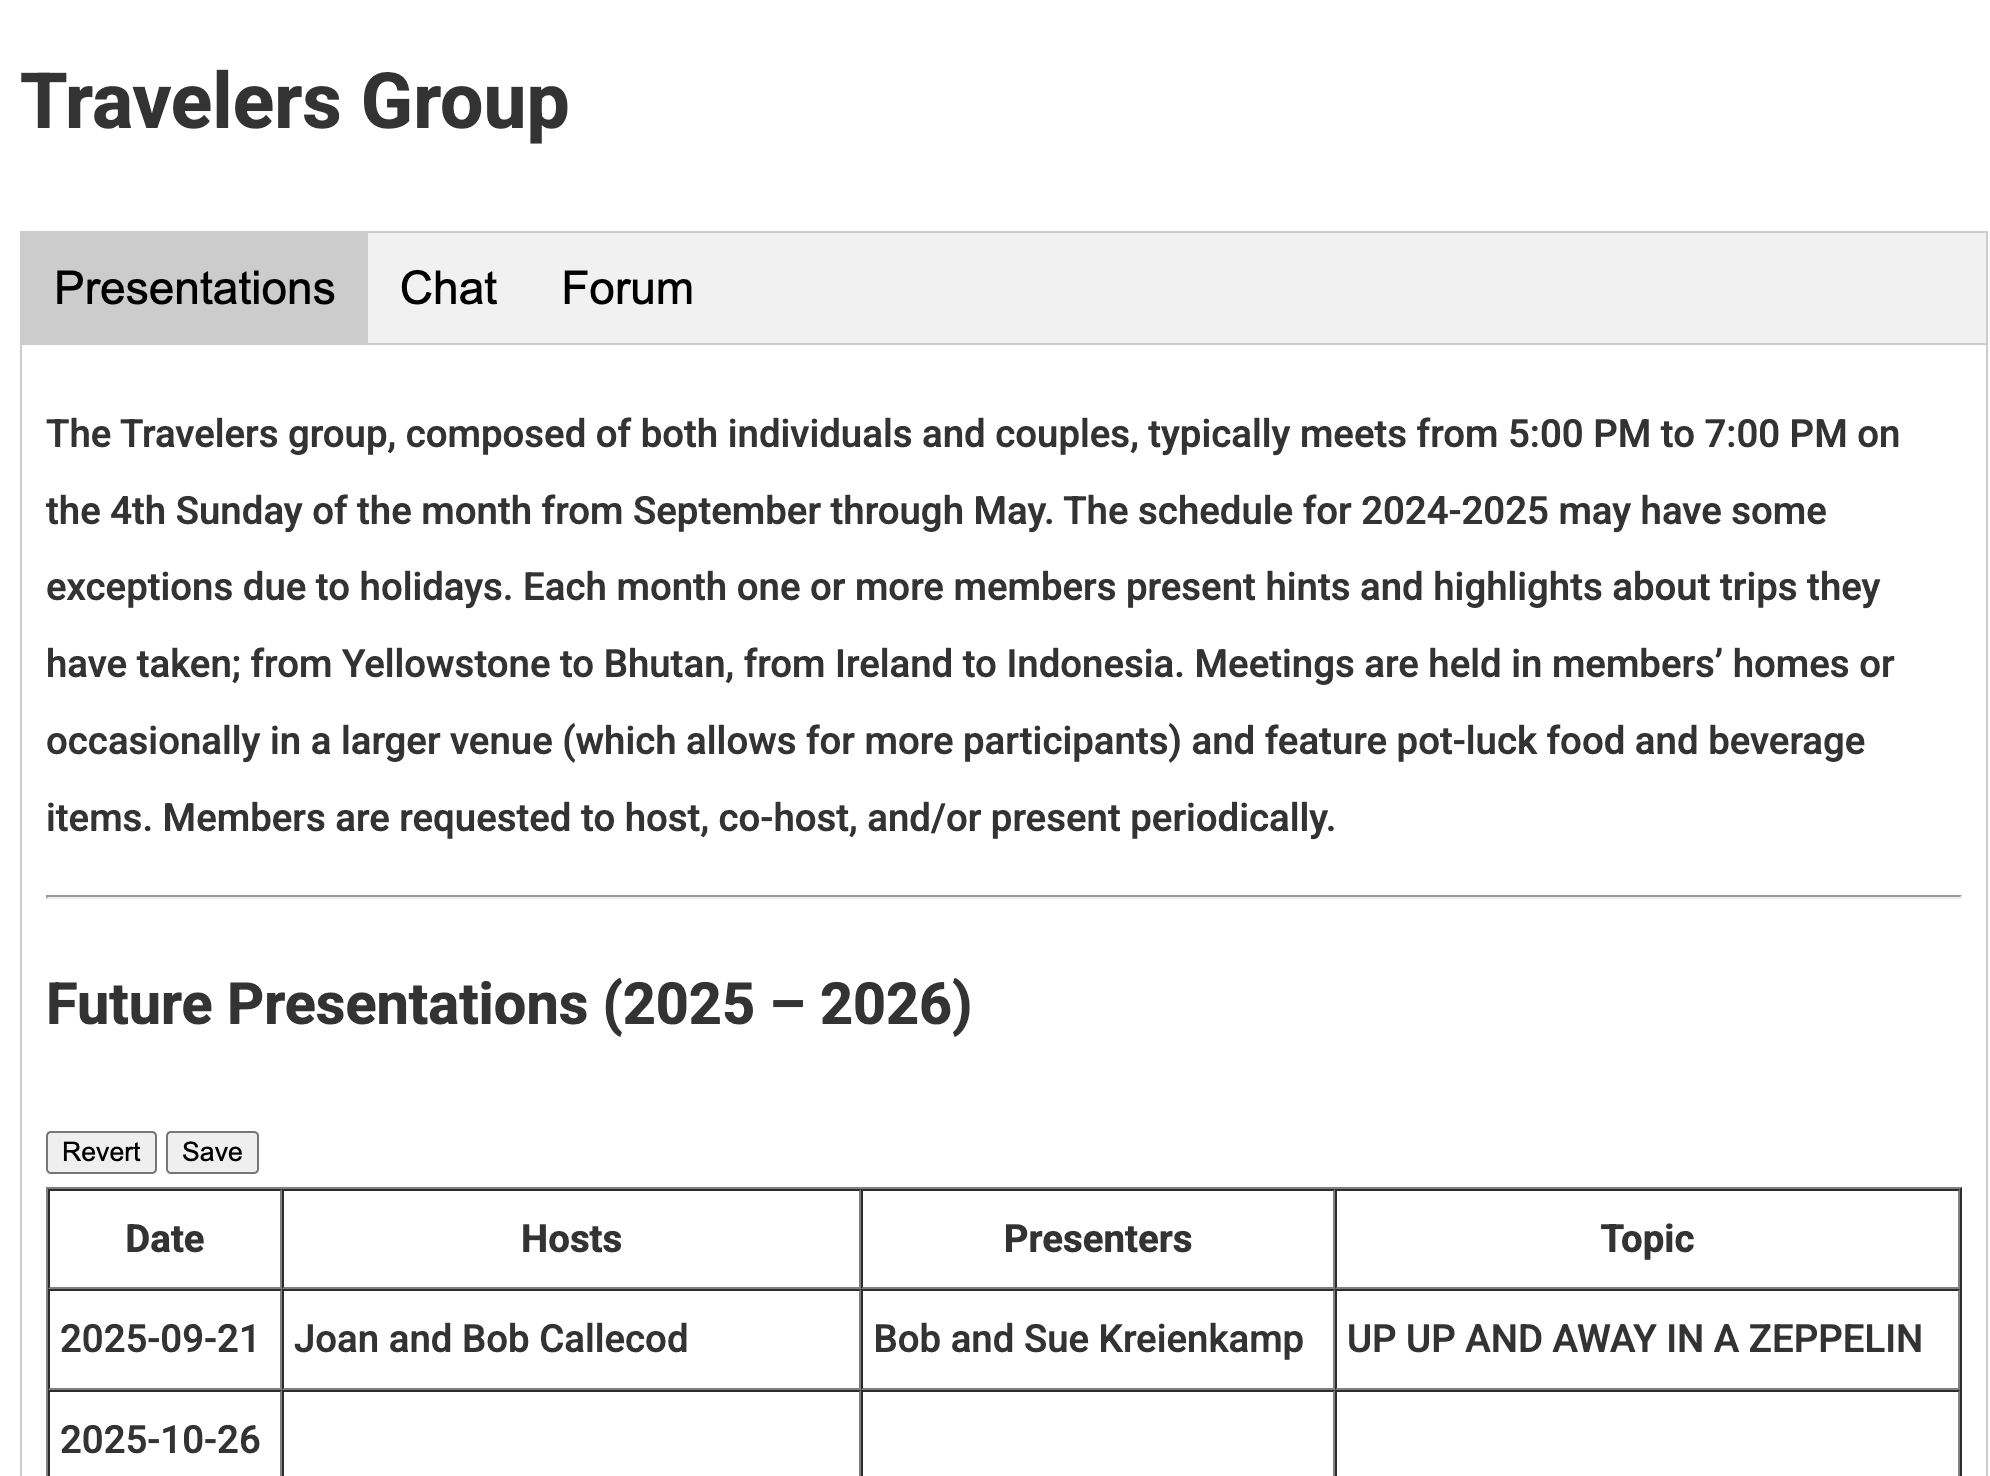
I have developed and currently maintain the website for the Travelers Group, a branch of the University Women’s Club. Unlike the previous version—which was a simple, infrequently updated static HTML page—the new site includes several interactive features such as:
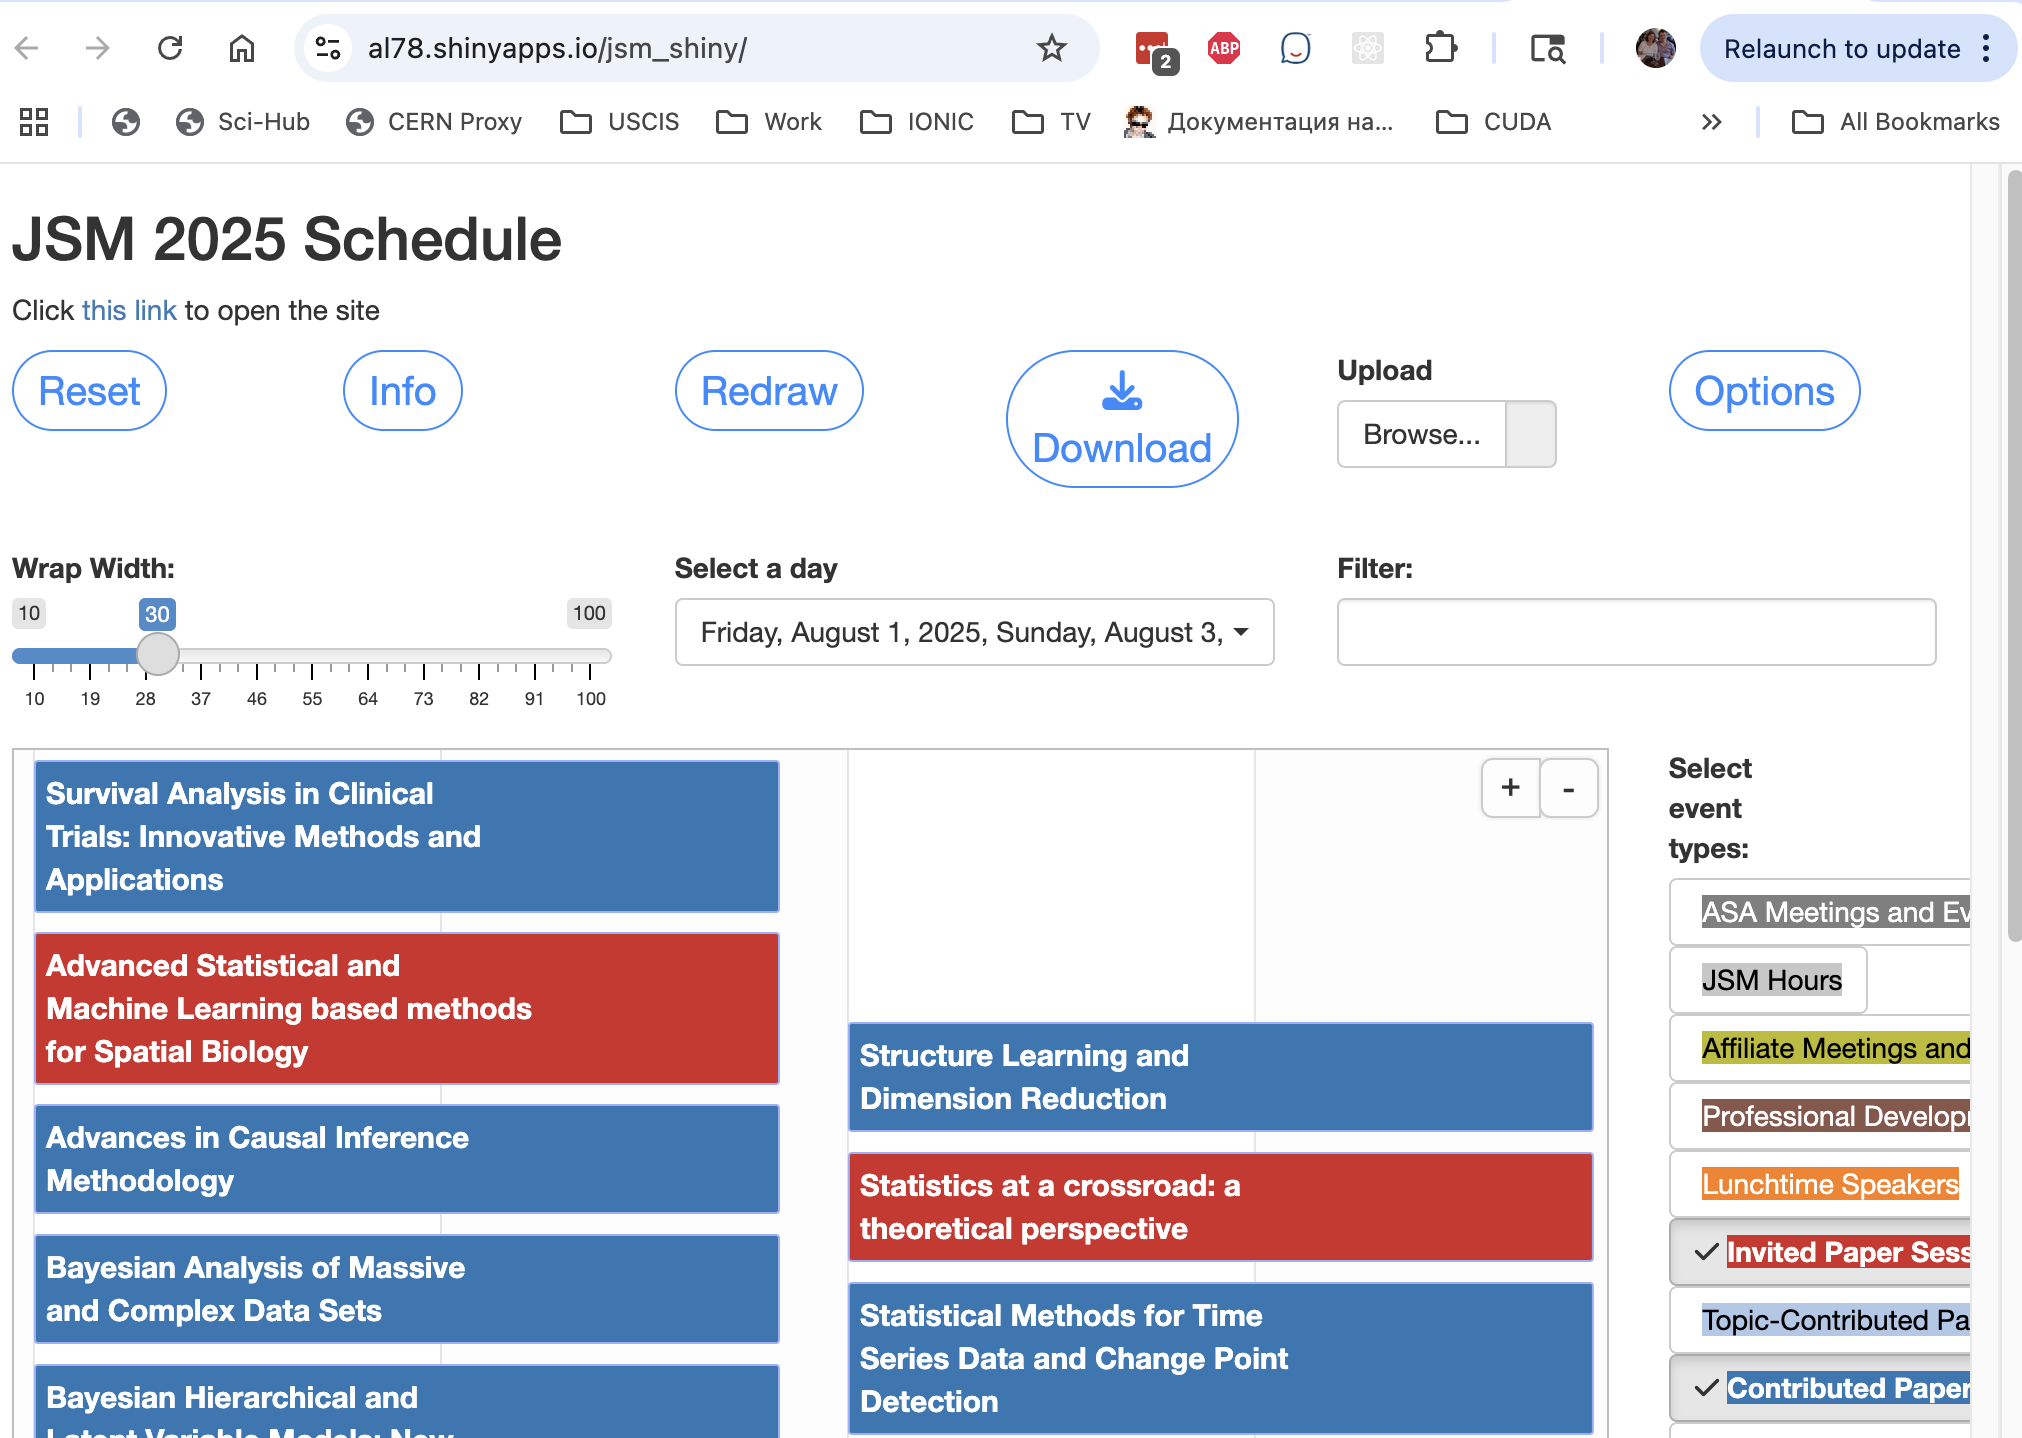
This is a Shiny application designed to help create a schedule for the JSM 2025 conference. It could be useful to anyone who is planning to attend the conference and wants to create a personalized schedule of sessions to attend. This application allows user to search for sessions he/she might be interested in, add or remove them from the schedule, save, load and share the list of selected events.
The app is built using R Shiny and provides an intuitive interface for users to manage conference sessions effectively.
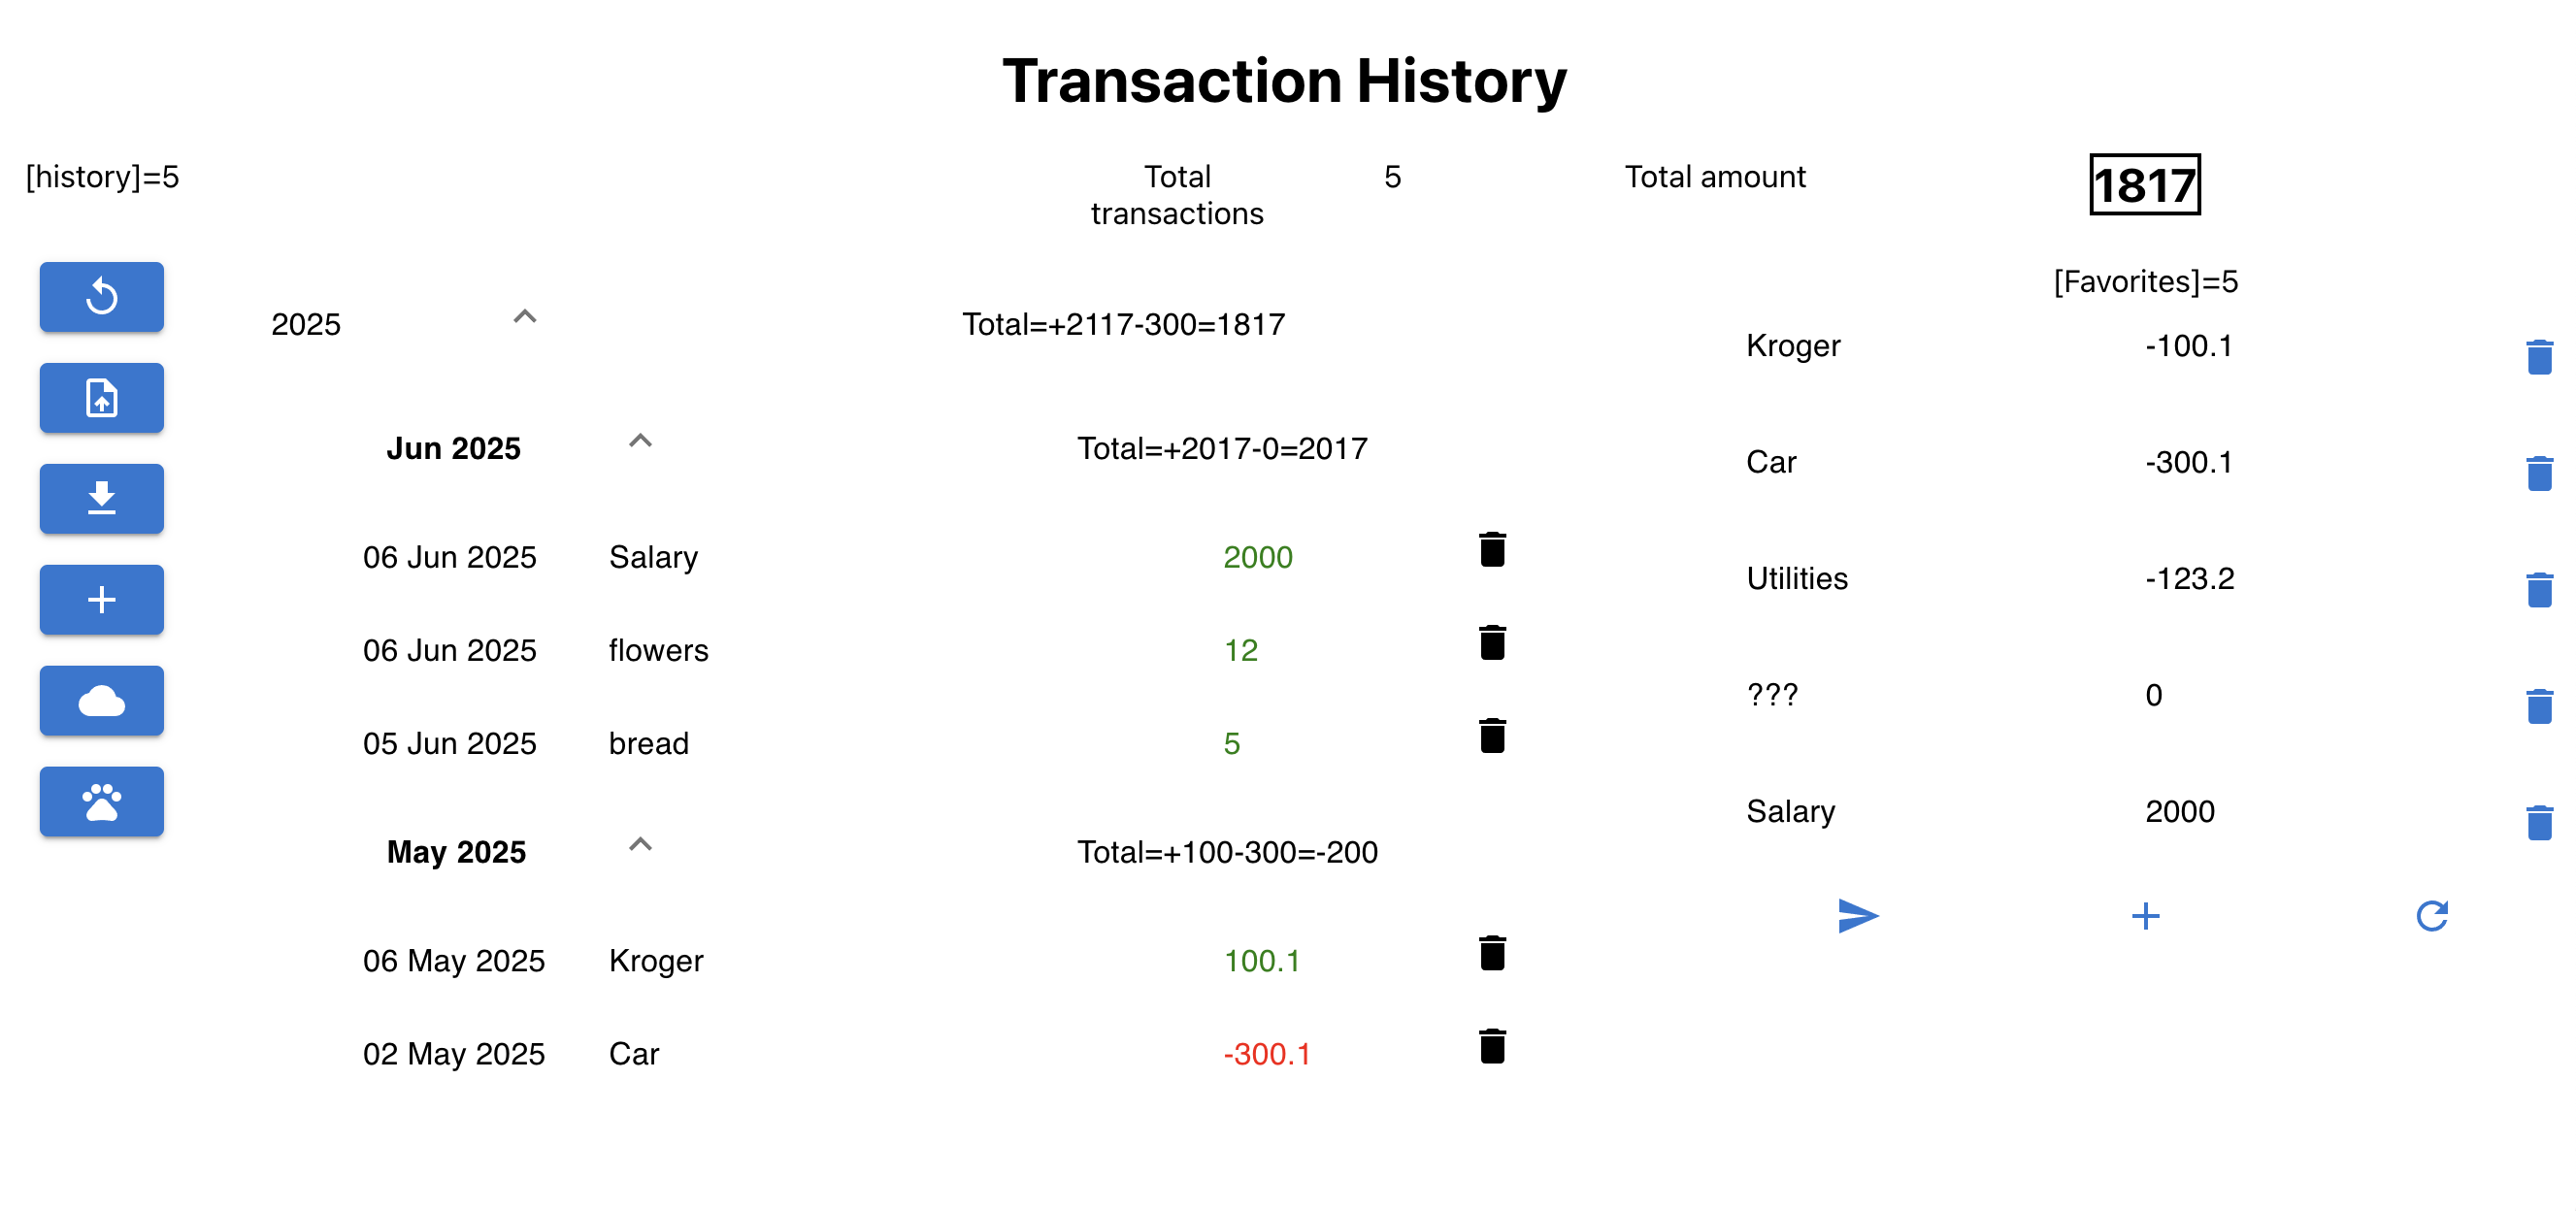
DFin is a web application for financial data analysis. It allows users to upload financial data, perform various analyses, and visualize results. The application is built using JavaScript and provides an intuitive interface for users to interact with their financial data.
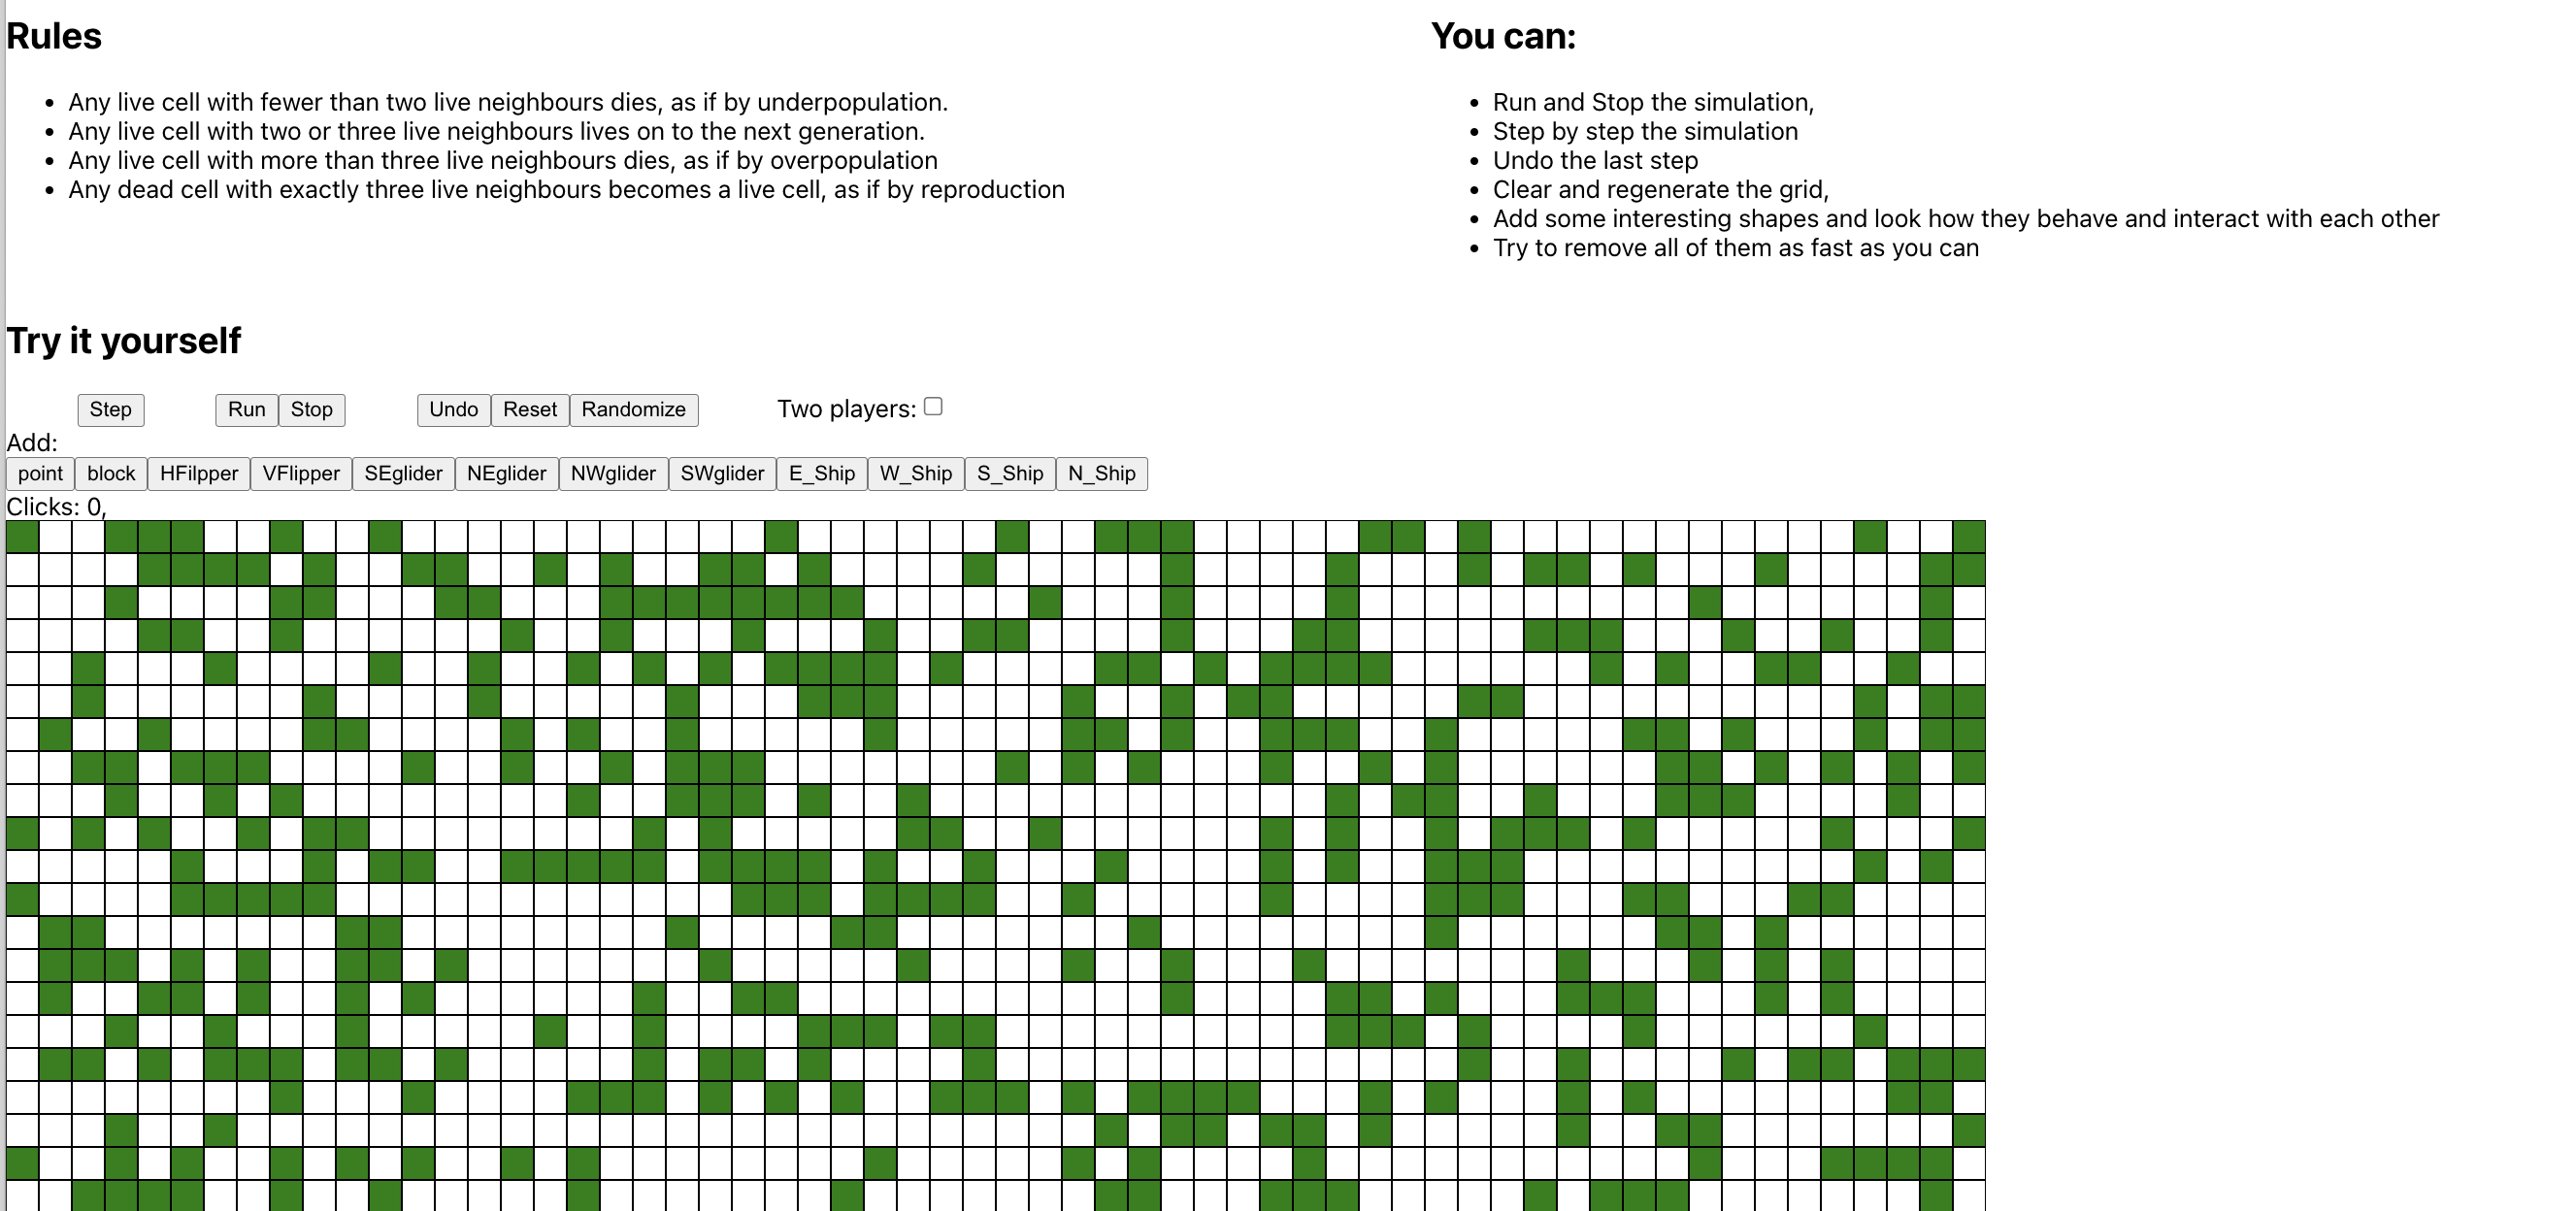
The Game of Life is a cellular automaton devised by the British mathematician John Horton Conway in 1970. It is a zero-player game, meaning that its evolution is determined by its initial state, requiring no further input. The game consists of a grid of cells that can be either alive or dead, and the state of each cell changes based on the states of its neighbors. In this project, I implemented the Game of Life using JavaScript, allowing users to interactively play the game and observe how patterns evolve over time.
BGSU ArtsX is a web application application designed to show some of the mathematical concepts and their application in the arts. It was used as a part of the ArtsX event at Bowling Green State University in 2023. The application features interactive visualizations and explanations of various mathematical concepts, making it accessible to a wide audience.
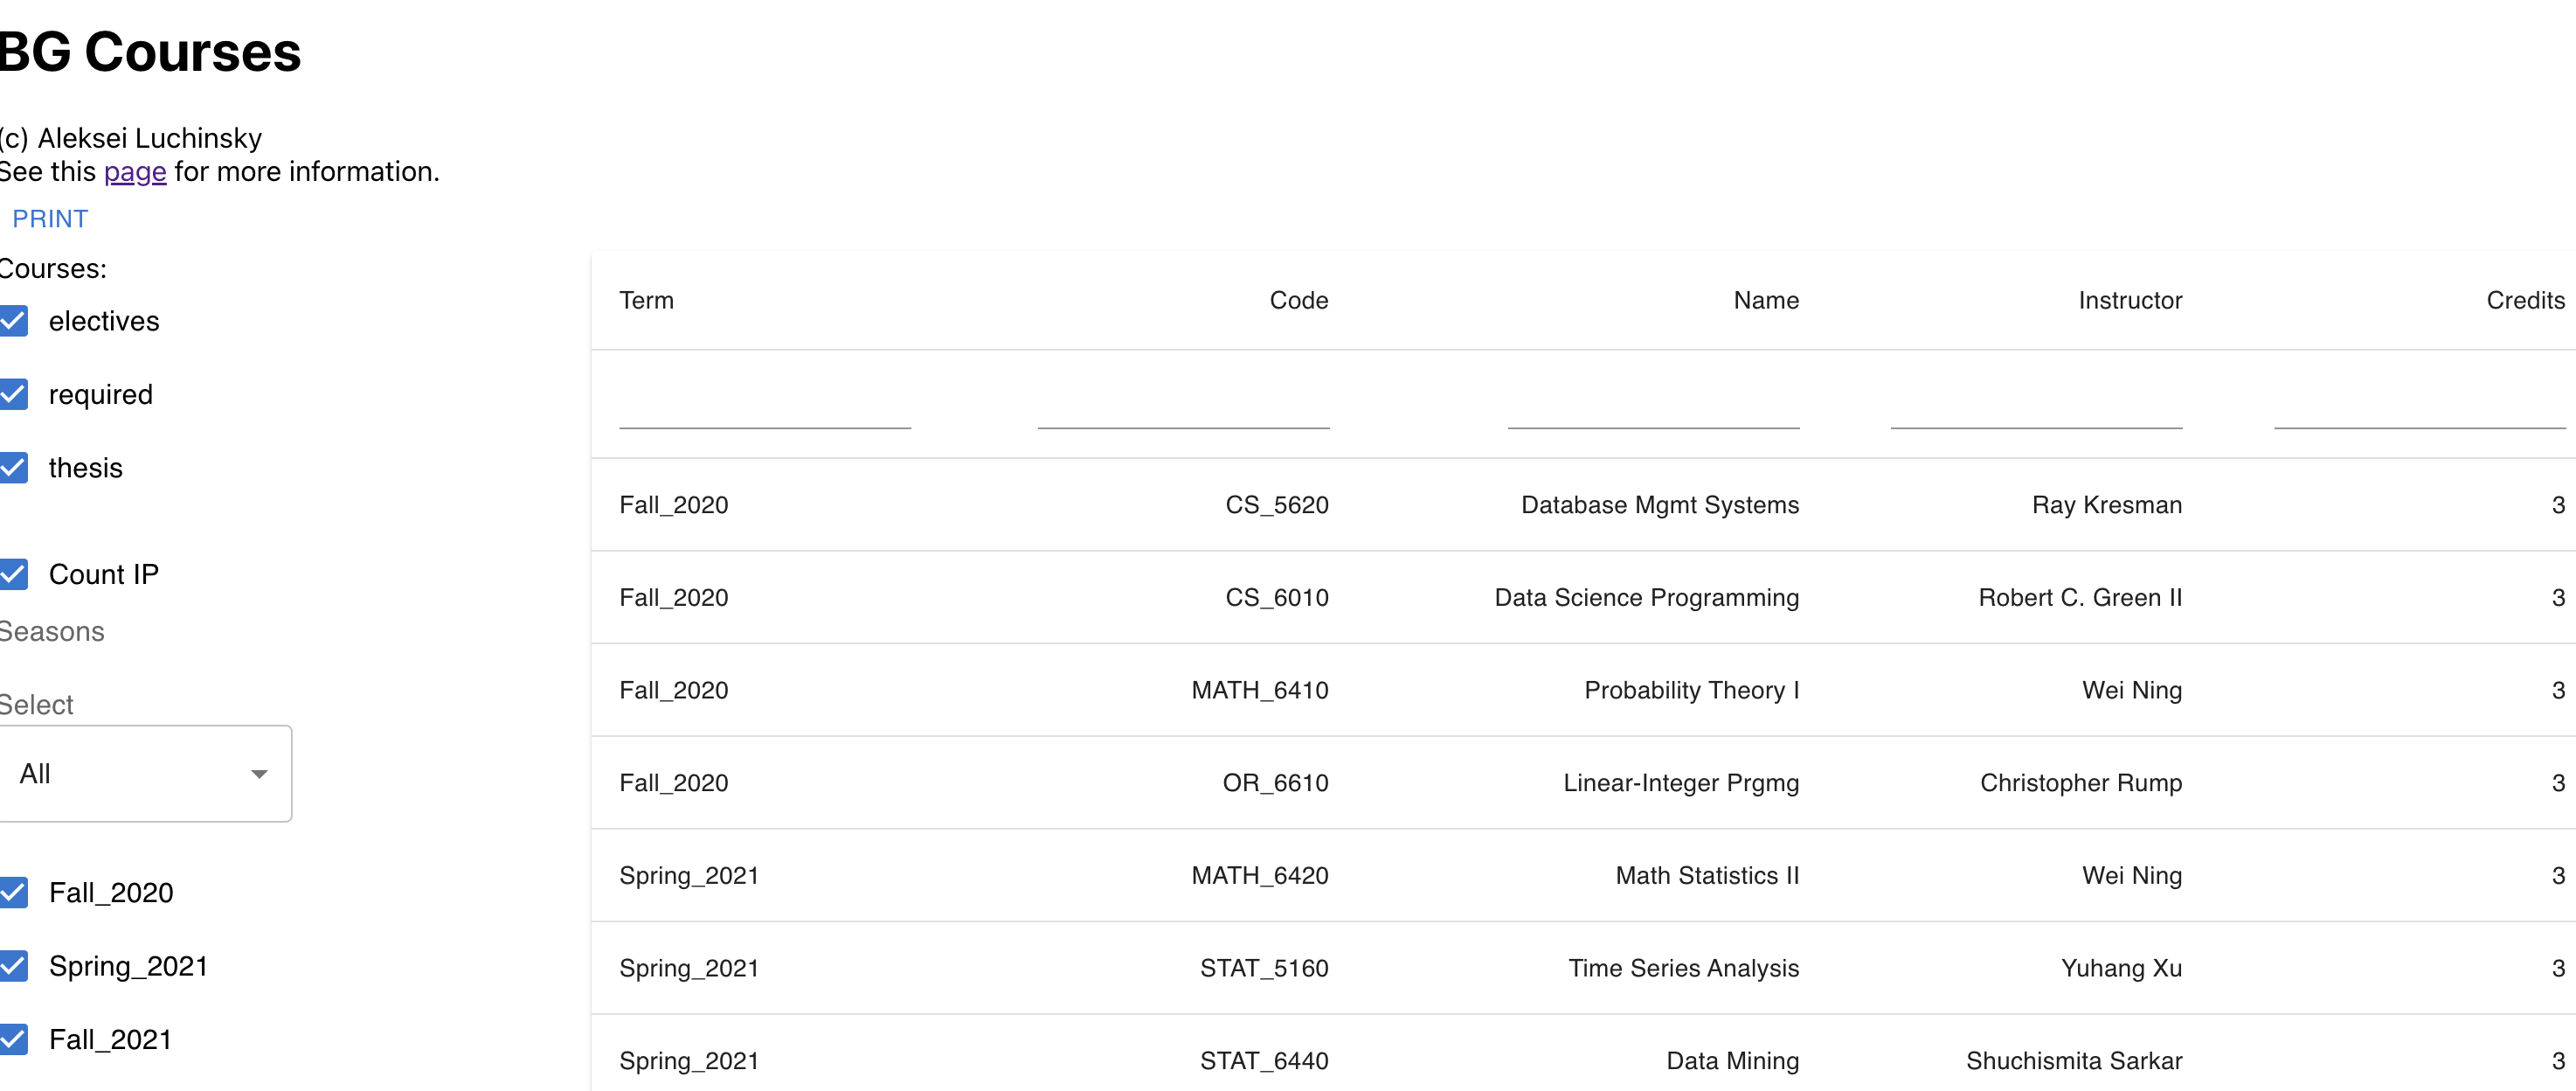
BG Courses is a web application designed to help me to keep track of my progress in Bowling Green State Univesity Master's and Ph.D. programs. With the help of this application I could easily monitor my course completion, GPA, and other academic metrics. The application provides a user-friendly interface for students to manage their academic journey effectively.
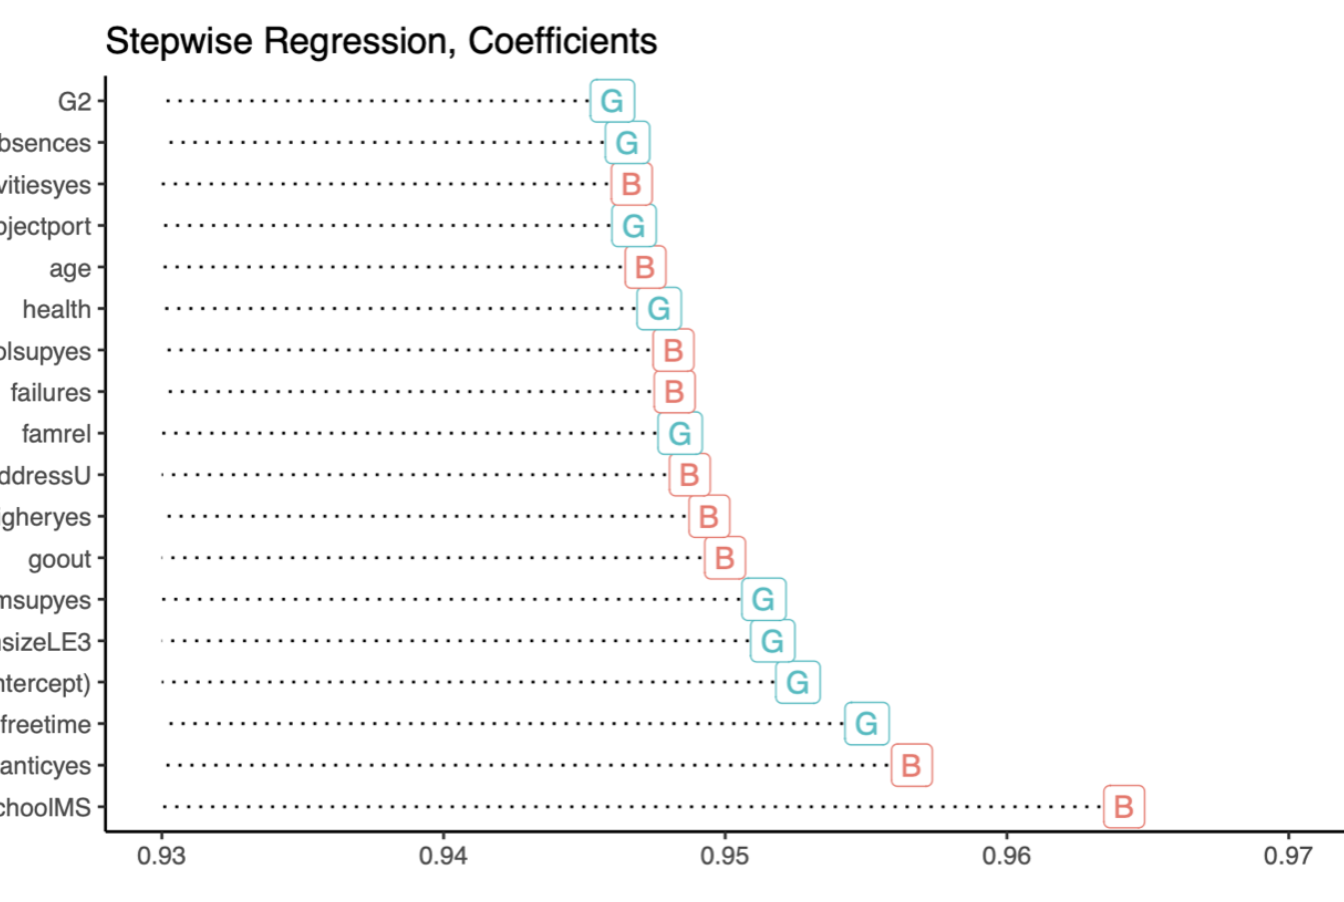
In this report, I analyzed student's performance dataset and tried to find out, why students do fail their classes. Both logistic regression and linear regression models are presented. The first one makes the classification, trying to predict, whether the student will fail his/her class or not. The second, linear regression, model predicts final grades of the students, that did not fail. Both models show good prediction accuracy both on training and test data sets. Some discussion about significant factors can be found at the end of the report.
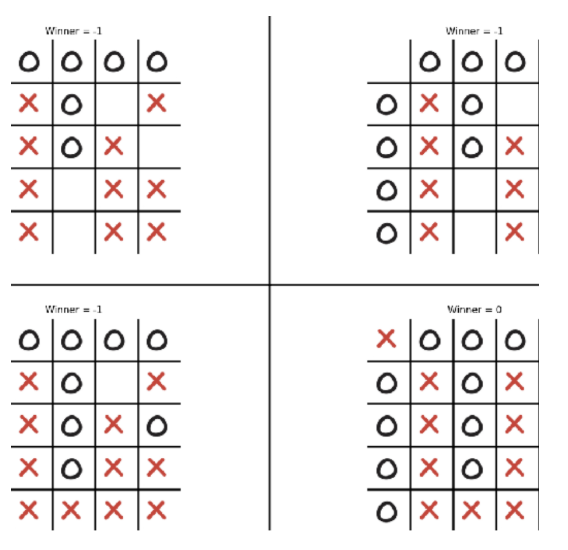
Unsupervised machine learning programs for playing some simple board games are considered. For the simplest one, naught and crosses game on a 3 × 3 board the program has found an optimal strategy without any prior knowledge about the game. In the case of a more complicated game on 5 × 5 playing board, the program sometimes makes errors, missing the evident winning moves.
This is a final project for Dr. Green’s CS5170 class
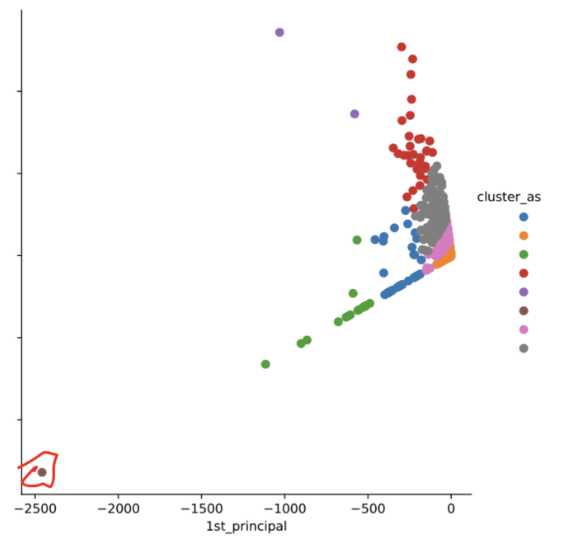
Clusterization of published articles in high energy physics based on keywords, extracted automatically from titles and abstracts of the papers
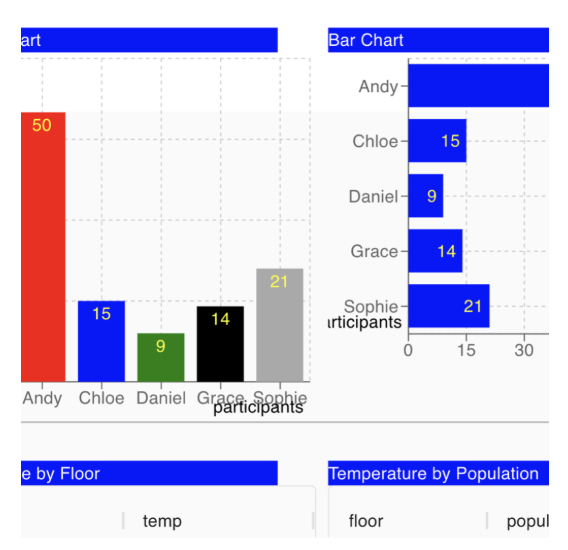
Online system for creating, modifying, and using dashboards that helps to get KPI information about the hotel performance
(MS Project)
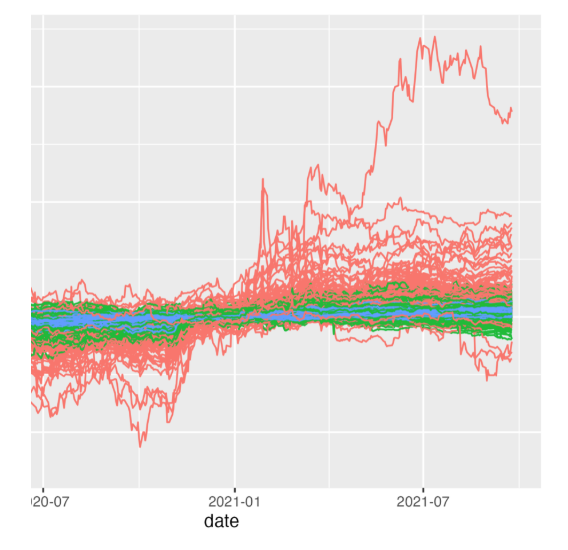
The subject of the project is the analysis of available Stock Market Prices data since the pandemic using the Functional Data Analysis (FDA) approach. The data were cleaned and transformed before the analysis using FDA. We applied functional principal component analysis (FPCA) and functional clustering (FC) to the data. Using FDA, the companies were clustered into an optimal number of groups required to explain the observed variation, after that the analysis and comparison of the clusters’ content was performed. Our results show that during the pandemic period (from March 13,2020 to the exact date) mostly increasing trends were observed, but the increasing trends are different from one cluster to another. Interesting findings on the industry sections and obtained clusters are also elaborated based on FC results
(with Jingyi Su, Kim Brooks, Vibhuti Chandna)
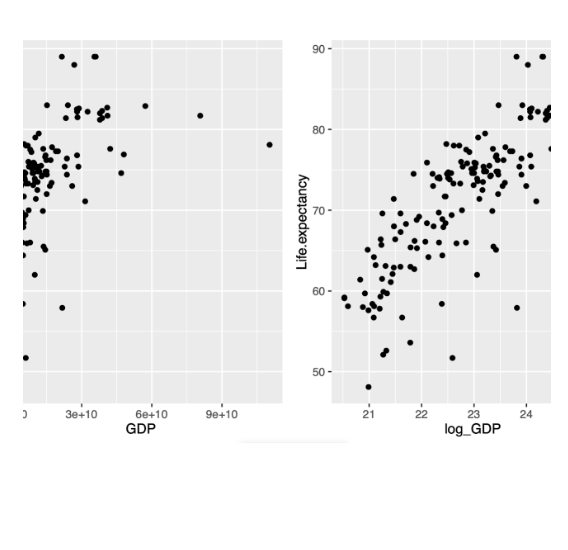
The paper is devoted to inspect the World Health Organization data on the life expectancy and to find out what factors correlate with the life expectancy the most. AThe final linear regression model explains 80% of the variance using only 6 regressor variables (including alcohol consumption, government expenditure on health, adult Mortality Rates, HIV/AIDS death rate, country development status, and interactions).
(with Jishan Ahmed, Donghyun Jeon, Upeksha Perera)
In this paper, we attempted to reproduce the results to validate the claims which were made by authors that the power of Jarque –Bera test is better for the symmetric distribution, whereas it performs poorly on the bimodal distribution.
(with Kim Brooks, Vibhuti Chandna, Dong Hyun Jeon)
This paper is devoted to the analysis of Multiple Sclerosis pattern in the United States. To perform the analysis, the data provided by Medical Expenditure Panel Survey was used. Methods such as Decision Tree, Logistic Regression, Neural Network, k-Nearest Neighbors, Random Forest, Adaptive Boosting, and Linear Regression were implemented to predict the probability of a person being diagnosed with MS and determine which demographic factors are important for answering this question.
(with Michael Terry and Vagish Vela)
In this report, we study the impact of COVID- 19 on several US states and how the disease compares with historical causes of death, and it’s potential contribution to excess deaths when compared to an equivalent historical time frame. We provide insights into how our data can support excess death analysis in the future, and reflect on the significant challenges, highlighted by our study, for future research in comparing COVID-19 datasets.